
- Service revenue up 39% year-over-year to $11.6 million, generating highest service margin in company history of 73%
- Annual recurring revenue(1) growth of 34% year-over-year to $39.7 million
- Net Dollar Retention(1) of 113% improves year-over-year from 103%
- Total operating expenses of $18.2 million, declining sequentially from $20.3 million
- Q1 Adjusted EBITDA(1) loss of $6.2 improves sequentially from a loss of $7.7 million
- Growth outlook and cost containment efforts support target of exiting fiscal 2023 generating Adjusted EBITDA profitability
Calgary, Canada — March 16, 2023 — Blackline Safety Corp. ("Blackline" or the "Company") (TSX: BLN), a global leader in connected safety technology, today reported record fiscal first quarter financial results for the period ended January 31, 2023.
Management Commentary
“Our strong Q1 growth of 34% represented our 24th consecutive quarter of strong year-over-year revenue growth, which was driven by increases in both our service and product segments increasing 39% and 29%, respectively. Our results in Q1 also displayed impressive progress and advancement of our cost reduction goals,” said Cody Slater, CEO and Chair of Blackline Safety. “Through our revenue growth and sales mix, we were able to deliver improved gross margins of 49% during the quarter, which marks our highest level since the second quarter of 2021. Looking forward, we see continued strong customer demand driving revenue growth coupled with our disciplined cost management approach enabling Blackline to achieve and sustain positive Adjusted EBITDA as we exit fiscal 2023.”
“In addition, our annual recurring revenue(1) advanced 34% year-over-year to $39.7 million. Regionally, we experienced year-over-year growth across the board highlighted by the United States increasing 36% benefiting from a robust pipeline, while Canada generated 69% growth.”
“On the margin front, we experienced the strongest service margins in Company history of 73%. Our product margins also improved significantly year-over-year from 10% to 21%, but declined when compared to Q4 FY 2022 due to lower volume, decreased percentage of sales generated through our leasing program, and foreign exchange impact. Looking forward, we anticipate margin improvements through the remainder of the fiscal year through the recent price increases and component costs reductions and efficiencies.”
"We made initial deliveries of our latest transformative product during Q1, the G6, and we anticipate demand and adoption to grow throughout the balance of this fiscal year while revenue is expected to be back-half weighted in fiscal 2023. We continue to see significant potential for G6 to disrupt and capture share in the $220 million annual zero-maintenance gas detection market.”
“We ended the first quarter in a solid financial position with total cash and short-term investments on hand of $23.5 million, while our cash burn rate improved for the third consecutive quarter. Furthermore, we continue to work towards finalizing a financial structure for the hardware equivalent element of our finance lease portfolio, which had a total undiscounted value of $35.5 million at the end of the quarter for the right to use the hardware and associated services. Importantly, this will supplement our liquidity position as we execute on our path to sustained profitability as we exit fiscal 2023.”
Fiscal First Quarter 2023 and Recent Financial and Operational Highlights
- Total revenue of $21.0 million, a 34% increase over the prior year’s Q1
- Service revenue of $11.6 million, a 39% increase over the prior year’s Q1
- Product revenue of $9.4 million, a 29% increase over the prior year’s Q1
- Canadian market momentum remains strong with 69% growth over prior year’s Q1
- United States regaining momentum with 36% growth over prior year’s Q1
- Annual recurring revenue(1) growth of 34% year-over-year to $39.7 million
- Rental revenue growth of 305% year-over-year
- Total operating expenses of $18.2 million, declining $2.1 million sequentially
- Released third annual Environment, Social & Governance (“ESG”) Report continuing our commitment to diversity, inclusion, environmental sustainability and community engagement
- Launched our first European Union (“EU") based service centre in France to serve the growing number of customers in Europe and provide an operational base to expand the Company’s rental offering in the region
- Announced a multi-year contract with a $1 million lifetime value in the Middle East, Blackline’s largest ever order in its Rest of World region
(1) This news release presents certain non-GAAP and supplementary financial measures, including key performance indicators used by management and typically used by companies in the software-as-a-service industry, as well as non-GAAP ratios to assist readers in understanding the Company’s performance. Further details on these measures and ratios are included in the “Key Performance Indicators,” and “Non-GAAP and Supplementary Financial Measures” sections of this news release.
Financial Highlights
Key Financial Information
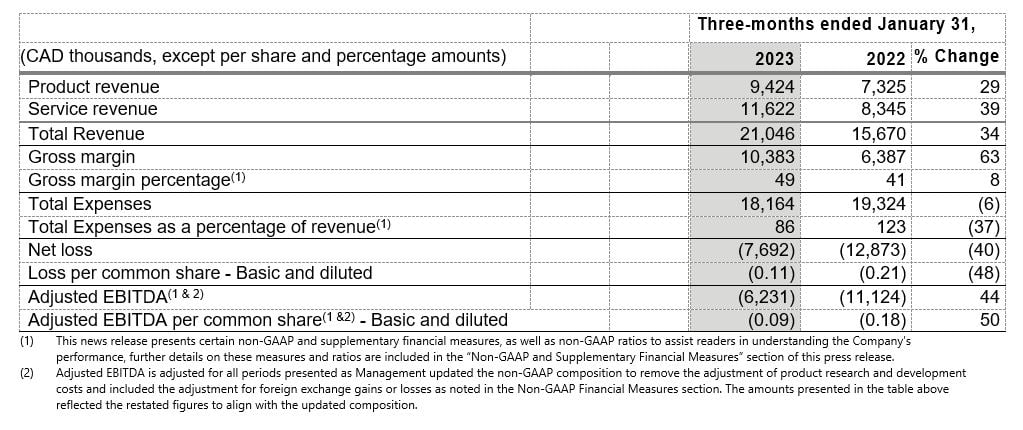
Fiscal first quarter revenue was $21.0 million, an increase of 34% from $15.7 million in the prior year quarter. Total revenue for each geographical market increased with Europe up 10%, Rest of World up 16%, United States up 36% and Canada up 69% representing the largest geographic growth region year-over-year.
Service revenue during the fiscal first quarter was $11.6 million, an increase of 39% compared to $8.3 million in the prior year quarter. Software services revenue increased 31% to $10.6 million and rental revenue increased 305% to $1.0 million. Software services growth was attributable to new activations of devices sold over the past 12 months as well as net growth within our existing customer base of $1.2 million. Rental revenue growth continues to be strong, up over 305% year-over-year, as our dedicated rental team continues to meet heightened demand for its connected solutions in the industrial construction, turnaround and maintenance markets.
Product revenue during the fiscal first quarter was $9.4 million, a 29% increase compared to the prior year quarter of $7.3 million. The increase in the current year period reflects the Company’s expanded sales network and investment in our global sales team over the past twelve months with continued strong demand generation and sales development activities.
Overall gross margin percentage for the fiscal first quarter was 49%, an 8% increase compared to the prior year quarter. The increase in total gross margin percentage is due to a combination of a higher sales volume and an enhanced pricing strategy. Product revenue comprised 45% of total revenue in the first quarter, a decrease of 2% from the prior year quarter, while service revenue made up 55% of total revenue for the quarter, representing a 2% increase. Service gross margin percentage increased to 73% compared to the prior year quarter at 68% as service revenue continued to grow, absorbing more fixed cost of sales.
Product gross margin percentage increased to 21% from 10% in the prior year quarter as the Company has been able to mitigate some of the global supply chain challenges that it has experienced since the third quarter of 2021. During the quarter the Company began completing some sales under our newly introduced pricing structure. The Company has been able to automate more of its manufacturing line, improving the efficiency and throughput of its operations.
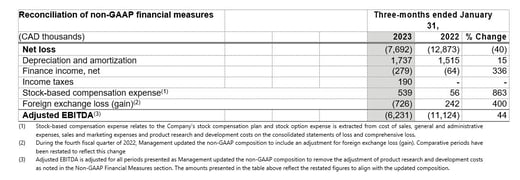
Net loss was $7.7 million, in the fiscal first quarter, compared to $12.9 million in the prior year quarter. Net loss decreased primarily due to decreases in sales and marketing expenses and an increase in gross margin, offset by increases in general and administrative expenses and product research and development costs.
Adjusted EBITDA(1) was ($6.2) million for the fiscal first quarter compared to ($11.1) million in the prior year quarter. The increase in Adjusted EBITDA is primarily due to the decrease in net loss.
At quarter end, Blackline had total cash and short-term investments on hand of $23.5 million and $7.0 million of availability on its senior secured operating facility. The decrease in cash and short-term investments is mainly due to operating losses. At quarter end, the Company had $8.0 million of borrowings on its senior secured operating facility, repaying $0.6 million during the quarter from operating cash flow.
Blackline’s Interim Condensed Consolidated Financial Statements and Management’s Discussion and Analysis on Financial Condition and Results of Operations for the three months ended January 31, 2023 are available on SEDAR under the Company’s profile at www.sedar.com. All results are reported in Canadian dollars.
Conference Call
A conference call and live webcast have been scheduled for 11:00 am ET on Thursday, March 16, 2023. Participants should dial 1-800-319-4610 or +1-416-915-3239 at least 10 minutes prior to the conference time. A live webcast will also be available at https://www.gowebcasting.com/12481. Participants should join the webcast at least 10 minutes prior to the conference time to register and install any necessary software. If you cannot make the call live, a replay will be available within 24 hours by dialing in to dialing 1-800-319-6413 and entering access code 9921.
About Blackline Safety
Blackline Safety is a technology leader driving innovation in the industrial workforce through IoT (Internet of Things). With connected safety devices and predictive analytics, Blackline enables companies to drive towards zero safety incidents and improved operational performance. Blackline provides wearable devices, personal and area gas monitoring, cloud-connected software and data analytics to meet demanding safety challenges and enhance overall productivity for organizations with coverage in more than 100 countries. Armed with cellular and satellite connectivity, Blackline provides a lifeline to tens of thousands of people, having reported over 200 billion data-points and initiated over seven million emergency responses. For more information, visit BlacklineSafety.com and connect with us on Facebook, Twitter, LinkedIn and Instagram.
INVESTOR AND ANALYST CONTACTS:
Matt Glover or Georg Venturatos
Telephone: +1 949 574 3860
MEDIA CONTACT
Christine Gillies, CPMO
cgillies@blacklinesafety.com
Telephone: +1 403 629 9434
Non-GAAP and Supplementary Financial Measures
This press release presents certain non-GAAP and supplementary financial measures, including key performance indicators used by management typically used by our competitors in the software-as-a-service industry, as well as non-GAAP ratios to assist readers in understanding the Company’s performance. These measures do not have any standardized meaning and therefore are unlikely to be comparable to similar measures presented by other issuers and should not be considered in isolation or as a substitute for measures of performance prepared in accordance with GAAP.
Management uses these non-GAAP and supplementary financial measures, as well as non-GAAP ratios and key performance indicators to analyze and evaluate operating performance. Blackline also believes the non-GAAP and supplementary financial measures defined below are commonly used by the investment community for valuation purposes, and are useful complementary measures of profitability, and provide metrics useful in Blackline’s industry.
Throughout this news release, the following terms are used, which do not have a standardized meaning under GAAP.
Key Performance Indicators
The Company recognizes service revenues ratably over the term of the service period under the provisions of agreements with customers. The terms of agreements, combined with high customer retention rates, provides the Company with a significant degree of visibility into near-term revenues. Management uses a number of metrics, including the ones identified below, to measure the Company’s performance and customer trends, which are used to prepare financial plans and shape future strategy. Key performance indicators may be calculated in a manner different than similar key performance indicators used by other companies.
- “Annual recurring revenue” (“ARR”) is the total annualized value of recurring service amounts (ultimately recognized as software services revenue) of all service contracts at a point in time. Annualized service amounts are determined solely by reference to the underlying contracts, normalizing for the varying revenue recognition treatments under IFRS 15 Revenue from Contracts with Customers. It excludes one-time fees, such as for non-recurring professional services, and assumes that customers will renew the contractual commitments on a periodic basis as those commitments come up for renewal, unless such renewal is known to be unlikely.
- “Net Dollar Retention” (”NDR”) compares the aggregate service revenue contractually committed for a full period under all customer agreements of our total customer base as of the beginning of each period to the total service revenue of the same group at the end of the period. It includes the effect of our service revenue that expands, renews, contracts or is declined, but excludes the total service revenue from new activations during the period. We believe that NDR provides a fair measure of the strength of our recurring revenue streams and growth within our existing customer base.
Non-GAAP Financial Measures
A non-GAAP financial measure: (a) depicts the historical or expected future financial performance, financial position or cash of the Company; (b) with respect to its composition, excludes an amount that is included in, or includes an amount that is excluded from, the composition of the most comparable financial measure presented in the primary consolidated financial statements; (c) is not presented in the primary financial statements of the Company; and (d) is not a ratio.
Non-GAAP financial measures presented and discussed in this news release are as follows:
“Adjusted EBITDA” is useful to securities analysts, investors and other interested parties in evaluating operating performance by presenting the results of the Company which excludes the impact of certain non-operational items and certain non-cash and non-recurring items, such as stock compensation expense. Adjusted EBITDA is calculated as earnings before interest expense, interest income, income taxes, depreciation and amortization, stock-based compensation expense, foreign exchange loss (gain), and non-recurring impact transactions, if any. The Company considers an item to be non-recurring when a similar revenue, expense, loss or gain is not reasonably likely to occur within the next two years or has not occurred during the prior two years.
Reconciliation of non-GAAP financial measures
Non-GAAP Ratios
A non-GAAP ratio is a financial measure presented in the form of a ratio, fraction, percentage or similar representation and that has a non-GAAP financial measure as one or more of its components.
Non-GAAP ratios presented and discussed in this news release is follows:
“Adjusted EBITDA per common share” is useful to securities analysts, investors and other interested parties in evaluating operating and financial performance. Adjusted EBITDA per common share is calculated on the same basis as net income (loss) per common share, utilizing the basic and diluted weighted average number of common shares outstanding during the periods presented.
Supplementary Financial Measures
A supplementary financial measure: (a) is, or is intended to be, disclosed on a periodic basis to depict the historical or expected future financial performance, financial position or cash flow of the Company; (b) is not presented in the financial statements of the Company; (c) is not a non-GAAP financial measure; and (d) is not a non-GAAP ratio.
Supplementary financial measures presented and discussed in this news release is as follows:
- “Gross margin percentage” represents gross margin as a percentage of revenue
- “Annual recurring revenue” represents total annualized value of recurring service amounts of all service contracts
- “Net dollar retention” represents the aggregate service revenue contractually committed
- “Product gross margin percentage” represents product gross margin as a percentage of product revenue
- “Service gross margin percentage” represents service gross margin as a percentage of service revenue
Note Regarding Forward-Looking Statements
This news release contains forward-looking statements and forward-looking information (collectively "forward-looking information") within the meaning of applicable securities laws relating to, among other things, Blackline’s expectation to deliver continued revenue growth, coupled with disciplined cost management, which is expected to allow Blackline to exit fiscal 2023 in a position of sustained positive Adjusted EBITDA, that the Company expects to realize continued improvement in product margins in fiscal 2023 driven by these pricing increases and enhancements through product redesigns and its view that product and service margins can approach 40% and 75%, respectively at the end of fiscal 2023, the Company's expectation that it will have liquidity to execute on its fiscal 2023 path to profitability and its ability to generate free cash flow, the anticipated effects an approximate 15% global pricing increase on products and services during Q4 will have on revenue and margins in fiscal 2023 and beyond . Blackline provided such forward-looking statements in reliance on certain expectations and assumptions that it believes are reasonable at the time. The material assumptions on which the forward-looking information in this news release are based, and the material risks and uncertainties underlying such forward-looking information, include: expectations and assumptions concerning business prospects and opportunities, customer demands, the availability and cost of financing, labor and services, that Blackline will pursue growth strategies and opportunities in the manner described herein, and that it will have sufficient resources and opportunities for the same, that other strategies or opportunities may be pursued in the future, and the impact of increasing competition, business and market conditions; the accuracy of outlooks and projections contained herein; that future business, regulatory, and industry conditions will be within the parameters expected by Blackline, including with respect to prices, margins, demand, supply, product availability, supplier agreements, availability, and cost of labour and interest, exchange, and effective tax rates; projected capital investment levels, the flexibility of capital spending plans, and associated sources of funding; cash flows, cash balances on hand, and access to the Company's credit facility being sufficient to fund capital investments; foreign exchange rates; near-term pricing and continued volatility of the market; accounting estimates and judgments; the ability to generate sufficient cash flow to meet current and future obligations; the Company's ability to obtain and retain qualified staff and equipment in a timely and cost-efficient manner; the Company's ability to carry out transactions on the desired terms and within the expected timelines; forecast inflation, including on the Company's components for its products, the impact of a potential pandemic and the war in Ukraine on the global economy; and other assumptions, risks, and uncertainties described from time to time in the filings made by Blackline with securities regulatory authorities. Although Blackline believes that the expectations and assumptions on which such forward-looking information is based are reasonable, undue reliance should not be placed on the forward-looking information because Blackline can give no assurance that they will prove to be correct. Forward-looking information addresses future events and conditions, which by their very nature involve inherent risks and uncertainties, including the risks set forth above and as discussed in Blackline's Management's Discussion and Analysis and Annual Information Form for the year ended October 31, 2022 and available on SEDAR at www.sedar.com. Blackline's actual results, performance or achievement could differ materially from those expressed in, or implied by, the forward-looking information and, accordingly, no assurance can be given that any of the events anticipated by the forward-looking information will transpire or occur, or if any of them do so, what benefits Blackline will derive therefrom. Management has included the above summary of assumptions and risks related to forward-looking information provided in this press release in order to provide readers with a more complete perspective on Blackline's future operations and such information may not be appropriate for other purposes. Readers are cautioned that the foregoing lists of factors are not exhaustive. These forward-looking statements are made as of the date of this press release and Blackline disclaims any intent or obligation to update publicly any forward-looking information, whether as a result of new information, future events or results or otherwise, other than as required by applicable securities laws.